作者:陽哥來源:Python資料之道大家好,我是陽哥。今天跟大家分享的是 Plotly Express 的詳細使用教程。Plotly Express 是 Python 互動式視覺化庫 Plotly 的高階元件,受 Seaborn
2021-07-24 03:07:05
作者:陽哥
來源:Python資料之道
大家好,我是陽哥。今天跟大家分享的是 Plotly Express 的詳細使用教程。
Plotly Express 是 Python 互動式視覺化庫 Plotly 的高階元件,受 Seaborn 和 ggplot2 的啟發,它專門設計為具有簡潔,一致且易於學習的 API :只需一次匯入,您就可以在一個函數呼叫中創建豐富的互動式繪圖,包括分面繪圖(faceting)、地圖、動畫和趨勢線等。
使用 Plotly Express 可以輕鬆地進行資料視覺化,一旦匯入Plotly Express(通常簡稱 px ),大多數繪圖只需要一個函數呼叫,接受一個整潔的 Pandas dataframe,並簡單描述你想要製作的圖。如果你想要一個基本的散點圖,它只是px.scatter(dataframe,x =「column_name」,y =「column_name」)。
Plotly Express 語法簡潔,同時功能強大,可以繪製咱們遇到的大部分圖表類型,比如線形圖、散點圖、柱狀圖、面積圖、樹形圖、旭日圖、甘特圖等,本文將從如下20個方面,詳細介紹 Plotly Express 的使用,看完內容介紹後,相信你也會喜歡上這個工具的。

部分動態圖如下:


Plotly 以及 Plotly Express 是互動式視覺化工具,陽哥錄製了一段簡短的視訊,來展示下其強大與優雅之處。(建議將視訊最大化後橫屏瀏覽)
環境準備
現在 Plotly Express 不需要單獨安裝,它是包含在 Plotly 中的,用 pip install plotly 命令可以安裝 Plotly,如果你用的是 Anaconda,也可以用 conda install plotly 命令來安裝,然後匯入如下:
import plotly.express as px
本文中,還用到 Pandas 等工具,完整的匯入如下:
import plotly.express as pximport plotly.io as pioimport plotly.graph_objects as goimport pandas as pd
本文程式碼測試的時候,使用的環境如下:
Mac系統
Jupyter Notebook
Python版本為 v3.8
Plotly version: 5.1.0
Pandas version: 1.3.0rc1
資料準備
本文涉及的圖形種類比較多,原本陽哥想用一份資料來覆蓋這些圖形的,後來發現不太現實,因此使用了多份資料。
對於大部分圖形,陽哥在文中使用的是 covid-19 的資料,此外,還使用了跟股票投資相關的一些資料。
這裡,先介紹下 covid-19 相關的資料。
我們需要讀取並整理出需要的DataFrame,以便在後續視覺化時使用。
分為三個小的步驟
(a) 讀取資料及調整格式
data = pd.read_csv('./data/covid-19.csv',parse_dates=['date'],index_col=0)# 將資料複製一份df_all = data.copy()# 將時間格式轉為字元串格式的日期,以 YYYY-mm-dd 的形式儲存df_all['dates'] = df_all['date'].apply(lambda x:x.strftime('%Y-%m-%d'))# 新增現存確診列df_all['current'] = df_all['confirmed'] - df_all['cured'] - df_all['dead']df_all.fillna('', inplace=True)print(df_all.info())df_all(b) 獲取全球的資料
# 國內總計數量df_cn = df_all.query("country=='中國' and province==''") df_cn = df_cn.sort_values('date',ascending=False)# 國外,按國家統計df_oversea = df_all.query("country!='中國'") df_oversea = df_oversea.fillna(value="")df_oversea = df_oversea.sort_values('date',ascending=False)df_global = df_cn.append(df_oversea)df_global = df_global.sort_values(['country','date'])df_global
(c) 更新全球的資料
countries_all = list(df_global['country'].unique())df_global_new = pd.DataFrame()for item in countries_all: df_item = df_global.query('country==@item') df_i = df_item.copy(deep=False) df_i['new-confirmed'] = df_i['confirmed'].diff() df_i['new-cured'] = df_i['cured'].diff() df_global_new = df_global_new.append(df_i) df_global_new = df_global_new.dropna()df_global_new
這兩個 DataFrame:df_global 和 df_global_new我們會在後續視覺化時多次用到。
說明:
文中使用的資料檔案,在文末提供獲取方式。
線形圖是所有視覺化工具中最常見的圖表之一,在 px 中,用 px.line() 來進行視覺化。
單條曲線
def plot_line(): df = df_global.groupby('date')[['confirmed','current','cured','dead']].sum() df['new-confirmed'] = df['confirmed'].diff() df = df.dropna() df = df.sort_index().loc['20200122':,:] fig = px.line(df,x=df.index,y='confirmed') return figfig = plot_line()# fig.write_image('./images/px/01-line-1.png')fig.show()
程式碼函數說明:
需要說明的是,在最簡潔的情況下,繪製線形圖只需要用 px.line(df,x =「column_name」,y =「column_name」) 來繪製即可,比如上面示例中的 px.line(df,x=df.index,y='confirmed')
由於本文涉及視覺化圖表比較多,需要調整的DataFrame也比較多,因此,陽哥一般以自定義函數的形式進行封裝,這樣顯得邏輯要清楚些。
實際上, Plotly Express 預設的視覺化,一般就是一行程式碼,這點咱們需要在腦海裡有個印象。
同時,在本文後續的圖表視覺化中,也是以這種形式進行的。
圖片儲存
在使用 Plotly 繪製圖片時,是可以將靜態圖片儲存下來的,具體方法請前往下面的連結檢視:
Plotly中如何儲存jpeg等圖片?
多條曲線繪製
在 Plotly v4.8 版本以後,支援同時繪製多條曲線,其語法格式為 px.line(df,x =「column_name」,y =[「column_name_1」,「column_name_2」,「column_name_3」,……])
示例如下:
def plot_line_multi(): df = df_global.groupby('date')[['confirmed','current','cured','dead']].sum() df['new-confirmed'] = df['confirmed'].diff() df = df.dropna() df = df.sort_index().loc['20200122':,:] fig = px.line(df,x=df.index,y=['confirmed','current','dead']) return figfig = plot_line_multi()# fig.write_image('./images/px/01-line-2.png')fig.show()
分列繪製曲線
Plotly Express 支援繪製分列或行的曲線圖,通過設定參數 facet_row 或 facet_col 來實現,示例如下:
# 繪製分列或行的曲線圖def plot_line_facet(): df = df_global_new.set_index('date').loc['20201204':'20201208',:] countries_list = ['美國','印度','俄羅斯','巴西','法國'] df = df[df['country'].isin(countries_list)] fig = px.line(df, x=df.index, y='new-confirmed', color='country', line_group='country', facet_col='country',# log_y=True, ) fig.update_traces(mode='markers+lines') return figfig = plot_line_facet()# fig.write_image('./images/px/01-line-3.png')fig.show()
在 Plotly Express 中,不止 px.line() 支援參數 facet_row 或 facet_col ,還有其他一些圖形也是支援的,比如散點圖、柱狀圖等,大家可以在 Jupyter Notebook 中檢視其是否有這兩個參數:

面積圖,跟線形圖有點類似,曲線下帶陰影面積,因此稱之為面積圖。
Plotly Express 中通過 px.area() 來實現,示例如下:
# 繪製填充的面積曲線圖def plot_area(): df = df_global_new.set_index('date').loc['20200904':'20201208',:] countries_list = ['美國','印度','俄羅斯','巴西','法國'] df = df[df['country'].isin(countries_list)] fig = px.area(df, x=df.index, y='confirmed', color='country', line_group='country' ) return figfig = plot_area()# fig.write_image('./images/px/02-area-1.png')fig.show()
散點圖,也是咱們常用的圖形之一,Plotly Express 中通過 px.scatter() 來實現,示例如下:
def plot_scatter_line(): df = df_global.groupby('date')[['confirmed','current','cured','dead']].sum() df['new-confirmed'] = df['confirmed'].diff() df = df.dropna() df = df.sort_index().loc['20200122':,:] fig = px.scatter(df,x='confirmed',y='dead') return figfig = plot_scatter_line()# fig.write_image('./images/px/03-sactter-1.png')fig.show()
上面這張圖,初看起來,跟線形圖有點類似,實際它是散點圖,只是點比較密集。
再來看一個示例,對全球多個國家的資料進行視覺化後,散點分佈就明顯了:
def plot_scatter(): df = df_global_new.set_index('date').loc['20201208':'20201208'] df = df.sort_values('confirmed',ascending=False).head(30) fig = px.scatter(df,x='confirmed',y='dead', color='country',size='confirmed' ) return figfig = plot_scatter()# fig.write_image('./images/px/03-sactter-2.png')fig.show()
散點矩陣圖
在 Plotly Express 中,針對散點矩陣圖,專門有一個API來實現 px.scatter_matrix(),示例如下:
def plot_scatter_matrix(): df = df_global_new.set_index('date').loc['20201208':'20201208'] df = df.sort_values('confirmed',ascending=False).head(30) fig = px.scatter_matrix(df,dimensions=['confirmed','cured','dead'], color='country',# size='confirmed' ) return figfig = plot_scatter_matrix()# fig.write_image('./images/px/03-sactter-3.png')fig.show()
繪製餅圖時,用的是跟股票投資相關的資料,資料如下:

資料檔案可在文末獲取
上面這份資料,可以更方便的以餅圖的形式來展示,在 Plotly Express 中,通過 px.pie() 來進行餅圖的視覺化,示例如下:
fig = px.pie(df_invest,values='持有市值',names='指數名稱')fig.update_traces(textposition='inside', textinfo='percent+label' )# fig.write_image('./images/px/04-pie-1.png')fig.show()
通過設定參數 hole,還可以將餅圖變為環形圖,如下:
fig = px.pie(df_invest,values='持有市值', names='指數名稱', hole=0.6 )fig.update_traces(textposition='inside', textinfo='percent+label' )# fig.write_image('./images/px/04-pie-2.png')fig.show()
柱狀圖,是資料視覺化中必不可少的基礎圖形,在 Plotly Express 中,通過 px.bar() 來實現。
垂直柱狀圖
預設情況下,px.bar() 繪製的是垂直柱狀圖,示例如下:
def plot_bar(): df = df_global_new.set_index('date').loc['20201208':'20201208'] df = df.sort_values('confirmed',ascending=False).head(30) fig = px.bar(df,x='country',y='confirmed',color='country') return figfig = plot_bar()# fig.write_image('./images/px/05-bar-1.png')fig.show()
水平柱狀圖
通過設定參數 orientation 的值,可以繪製水平柱狀圖,示例如下:
def plot_bar_h(): df = df_global_new.set_index('date').loc['20201208':'20201208'] df = df.sort_values('confirmed',ascending=False).head(30) fig = px.bar(df,x='confirmed',y='country', color='country',orientation='h' ) return figfig = plot_bar_h()# fig.write_image('./images/px/05-bar-2.png')fig.show()
對數座標
上面的水平柱狀圖,由於最大的數值和最小的數值差異比較大,用資料絕對值進行視覺化時,圖表的展示效果可能不是太好,這個時候,可以考慮用對數座標來展示,通過設定參數 log_x 或 log_y 來實現, 如下:
def plot_bar_log(): df = df_global_new.set_index('date').loc['20201208':'20201208'] df = df.sort_values('confirmed',ascending=False).head(30) fig = px.bar(df,x='confirmed',y='country', color='country',orientation='h', log_x=True # log_x 對數座標 ) return figfig = plot_bar_log()# fig.write_image('./images/px/05-bar-3.png')fig.show()
柱狀圖的展現方式
當同一系列中有不同的類型時,繪製柱狀圖的時候,通常有堆積和分組兩種展示形式,預設情況下,是堆積柱狀圖,如下:
def plot_bar_stack(): df = df_global_new.set_index('date').loc['20201201':'20201208',:] countries_list = ['美國','印度','俄羅斯','巴西','法國'] df = df[df['country'].isin(countries_list)] fig = px.bar(df,x=df.index, y='confirmed', color='country' ) return figfig = plot_bar_stack()# fig.write_image('./images/px/05-bar-4.png')fig.show()
通過設定參數 barmode="group" 可以轉變為分組的柱狀圖,如下:
def plot_bar_group(): df = df_global_new.set_index('date').loc['20201201':'20201208',:] countries_list = ['美國','印度','俄羅斯','巴西','法國'] df = df[df['country'].isin(countries_list)] fig = px.bar(df,x=df.index, y='confirmed', color='country', barmode='group' ) return figfig = plot_bar_group()# fig.write_image('./images/px/05-bar-6.png')fig.show()
此外,在 Plotly 5.1版本中,還支援設定樣式形狀,有兩個相關的參數,pattern_shape 和 patter_shape_sequence,如下:
def plot_bar_shape(): df = df_global_new.set_index('date').loc['20201201':'20201208',:] countries_list = ['美國','印度','俄羅斯','巴西','法國'] df = df[df['country'].isin(countries_list)] fig = px.bar(df,x=df.index, y='confirmed', color='country', pattern_shape="country", pattern_shape_sequence=[".", "x", "+",'/','\'], ) return figfig = plot_bar_shape()# fig.write_image('./images/px/05-bar-5.png')fig.show()
又稱為盒須圖、盒式圖或箱線圖,是一種用作顯示一組資料分散情況資料的統計圖,因形狀如箱子而得名。它能顯示出一組資料的最大值、最小值、中位數、及上下四分位數。
在股票以及指數基金投資時,我個人喜歡用箱形圖來對標的的估值分佈情況進行視覺化,效果如下:

因此,針對箱形圖,我準備了一份類似的資料,是ETF的淨值資料,資料結構如下:

針對ETF的累計淨值資料繪製箱形圖,通過 px.box() 來實現,如下:
fig = px.box(df3,x='code',y='累計淨值',color='code')# fig.write_image('./images/px/06-box-1.png')fig.show()
通過設定參數 orientation 的值,可以繪製水平箱形圖,示例如下:
fig = px.box(df3,x='累計淨值',y='code',color='code',orientation='h')# fig.write_image('./images/px/06-box-2.png')fig.show()
小提琴圖 (Violin Plot)是用來展示多組資料的分佈狀態以及概率密度。這種圖表結合了箱形圖和密度圖的特徵,主要用來顯示資料的分佈形狀。跟箱形圖類似,但是在密度層面展示更好。在資料量非常大不方便一個一個展示的時候小提琴圖特別適用。
Plotly Express 中通過 px.violin() 來實現,如下:
fig = px.violin(df3,x='code',y='累計淨值',color='code')# fig.write_image('./images/px/07-violin-1.png')fig.show()
上面的圖只展示了資料密度分佈情況,沒有顯示箱體及具體的分位數值情況,可以通過設定參數 box=True 來顯示箱體,如下:
fig = px.violin(df3,x='code',y='累計淨值', color='code', box=True)# fig.write_image('./images/px/07-violin-2.png')fig.show()
在顯示箱體後,可以更好的體現出資料的密度分佈以及數值分位情況。
此外,通過設定參數 points='all' ,可以在小提琴圖旁邊展示資料的密度分佈情況,如下:
fig = px.violin(df3,x='code',y='累計淨值', color='code', box=True, points='all')# fig.write_image('./images/px/07-violin-3.png')fig.show()
同樣地,我們也可以以水平的方式來展示小提琴圖,通過設定參數 orientation='h' 即可,如下:
fig = px.violin(df3,x='累計淨值',y='code', color='code',box=True, points='all', orientation='h' )# fig.write_image('./images/px/07-violin-4.png')fig.show()
在小提琴圖中,資料密度分佈是通過設定參數 point 來實現的,在 Plotly Express 中,還有一個專門的函數 px.strip(),來繪製資料密度分佈,如下:
fig = px.strip(df3,y='code',x='累計淨值')# fig.write_image('./images/px/07-violin-5.png')fig.show()
還可以創建聯合分佈圖(marginal rugs),使用直方圖,箱形圖(box)或小提琴來顯示雙變數分佈,也可以新增趨勢線。Plotly Express 甚至可以幫助你在懸停框中新增線條公式和 R 值!它使用 statsmodels 進行普通最小二乘(OLS)迴歸或局部加權散點圖平滑(LOWESS)。
使用小提琴圖和箱形圖
def plot_marginal(): df = df_global_new.query('country=="美國" or country=="印度"') fig = px.scatter(df,x='new-confirmed',y='new-cured', color='country', # size='confirmed', trendline='ols', marginal_x='violin', marginal_y= 'box' ) return figfig = plot_marginal()# fig.write_image('./images/px/08-marginal-1.png')fig.show()

使用小提琴圖和直方圖
def plot_marginal_hist(): df = df_global_new.query('country=="美國" or country=="印度"') fig = px.scatter(df,x='new-confirmed',y='new-cured', color='country', # size='confirmed', trendline='ols', marginal_x='violin', marginal_y= 'histogram' ) return figfig = plot_marginal_hist()# fig.write_image('./images/px/08-marginal-2.png')fig.show()
直方圖(Histogram),又稱質量分佈圖,是一種統計報告圖,由一系列高度不等的縱向條紋或線段表示資料分佈的情況。一般用橫軸表示資料類型,縱軸表示分佈情況。
在 Plotly Express 中,通過 px.histogram() 來實現。
預設情況下,縱軸以計數形式(count)表示資料分佈情況。
df_hist = df3[df3['code']=='515180']fig = px.histogram(df_hist,x='return')# fig.write_image('./images/px/09-hist-1.png')fig.show()
通過參數 histnorm 可以設定縱軸資料分佈的展現方式,其值可以是 'percent', 'probability', 'density', 或 'probability density'
縱軸為百分比的示例如下:
fig = px.histogram(df_hist,x='return',histnorm='percent')# fig.write_image('./images/px/09-hist-2.png')fig.show()
通過設定參數 color ,可以同時對多個物件進行視覺化,示例如下:
fig = px.histogram(df3,x='return',color='code')# fig.write_image('./images/px/09-hist-3.png')fig.show()
漏斗圖是一種形如漏斗狀的明晰展示事件和項目環節的圖形。漏斗圖由橫行或豎形條狀形狀一層層拼接而成 ,分別組成按一定順序排列的階段層級。每一層都用於表示不同的階段,從而呈現出這些階段之間的某項要素/指標遞減的趨勢。
漏斗圖在常常應用於各行業的管理。
網站轉化率是指使用者通過網站進行了相應目標行動的訪問次數與總訪問次數的比率,相應的行動可以是使用者註冊、使用者參與、使用者購買等一系列使用者行為,而漏斗圖是最能表示網站轉化率的圖表。
示例如下:
data = dict( number=[10000, 7000, 4000, 2000, 1000], stage=["瀏覽次數", "關注數量", "下載數量", "諮詢數量", "成交數量"])fig = px.funnel(data, x='number', y='stage')# fig.write_image('./images/px/10-funnel-1.png')fig.show()
還有一種是面積漏斗圖,通過 px.funnel_area() 來實現。
fig = px.funnel_area(names=["第一階段", "第二階段", "第三階段", "第四階段", "第五階段"], values=[10000, 7000, 4000, 2000, 1000])# fig.write_image('./images/px/10-funnel-2.png')fig.show()
平行座標圖 (parallel coordinate plot) 是視覺化高維多元資料的一種常用方法,為了顯示多維空間中的一組物件,繪製由多條平行且等距分佈的軸,並將多維空間中的物件表示為在平行軸上具有頂點的折線。頂點在每一個軸上的位置就對應了該物件在該維度上的中的變數數值。
平行座標圖可以方便的展示資料標籤分類或者資料流向。
資料標籤分類的示例如下:
def plot_para(): df = df_global_new.set_index('date').loc['20201125':'20201208',:] countries_list = ['美國','印度','俄羅斯','巴西','法國'] n = len(countries_list) countries_dict = {countries_list[x]:n-x for x in range(n)}# countries_dict = {'美國': 5, '印度': 4, '俄羅斯': 3, '巴西': 2, '法國': 1} df = df[df['country'].isin(countries_list)] df = df.reset_index() df = df[['country','confirmed','current','cured','dead']] df['country_id'] = df['country'].apply(lambda x: countries_dict[x])# print(df) fig = px.parallel_coordinates(df,color='country_id', labels={"country_id": "Country", "confirmed": "confirmed", "current": "current", "cured": "cured", "dead": "dead", }, color_continuous_scale=px.colors.diverging.Tealrose, # color_continuous_midpoint=3 ) return figfig = plot_para()# fig.write_image('./images/px/11-para-1.png')fig.show()
上圖展示的是5個國家的疫情資料特徵分佈,展示不同國家(國家以 1、2、3、4、5代表)在累計確診人數、現存確診人數、累計治癒人數、累計死亡人數的分佈情況。
這種類型的平行座標圖適合對資料分類進行視覺化。
還有一類平行座標圖,適合對資料流向進行視覺化,有點類似桑基圖,不過展現形式稍微有點區別。在 Plotly Express 中, 通過 px.parallel_categories() 來實現。
下面以投資資料為例,來進行演示:
def plot_para_cat(): df = df_invest.reindex(columns=['市場','指數名稱','標的名稱','持有市值']) fig = px.parallel_categories(df, color="持有市值", color_continuous_scale=px.colors.sequential.PuBu ) return figfig = plot_para_cat()# fig.write_image('./images/px/11-para-2.png')fig.show()

從上面這個資料流向的平行座標圖,可以從市場、指數名稱、標的名稱等維度來對投資資料的情況進行分析。
密度圖表現與資料值對應的邊界或域物件的一種理論圖形表示方法,一般用於呈現連續變數。
在 Plotly Express 中, 通過 px.density_contour() 來實現。
示例如下:
iris = px.data.iris()fig = px.density_contour(iris, x="sepal_width", y="sepal_length")# fig.write_image('./images/px/12-density-1.png')fig.show()
可以通過設定參數 color 來顯示不同類別的顏色,如下「
fig = px.density_contour(iris, x="sepal_width", y="sepal_length",color='species')# fig.write_image('./images/px/12-density-2.png')fig.show()
極座標圖可用來顯示一段時間內的資料變化,或顯示各項之間的比較情況。適用於列舉的資料,比如不同地域之間的資料比較。
極座標柱狀圖
在極座標下,以柱狀圖的形式對資料進行視覺化,在 Plotly Express 中, 通過 px.bar_polar() 來實現。
以疫情資料為例,對不同國家的資料演示如下:
# 將累計確診人數劃分為不同的範圍等級def confirm_class(x): if x<=50000: y='1' elif 50000<x<=100000: y='2' elif 100000<x<=500000: y='3' elif 500000<x<=900000: y='4' elif 900000<x<=1200000: y='5' elif 1200000<x<=1700000: y='6' elif x>1700000: y='7' return ycountries_list = ['法國','義大利','英國','西班牙','阿根廷', '哥倫比亞','德國','墨西哥','波蘭','伊朗', '祕魯','土耳其','烏克蘭','南非' ]df_global_top10_tmp = df_global_new[df_global_new['country'].isin(countries_list)]# SettingWithCopyWarningdf_global_top10 = df_global_top10_tmp.copy(deep=False)df_global_top10['gradient'] = df_global_top10['confirmed'].apply(confirm_class)# df_global_top10fig = px.bar_polar(df_global_top10, r="confirmed", theta="country", color="gradient", color_discrete_sequence= px.colors.sequential.Blugrn )# fig.write_image('./images/px/13-polar-2.png')fig.show()
極座標散點圖
此外,在極座標下,也可以使用散點圖來對資料進行視覺化,在 Plotly Express 中, 通過 px.scatter_polar() 來實現,示例如下:
fig = px.scatter_polar(df_global_top10, r="confirmed", theta="country", color="gradient", symbol="gradient", color_discrete_sequence=px.colors.sequential.Blugrn)# fig.write_image('./images/px/13-polar-3.png')fig.show()
雷達圖
在 Plotly Express 中,還支援極座標線形圖(實際上是雷達圖),通過 px.line_polar() 來實現,繼續以上面的資料為例,如下:
fig = px.line_polar(df_global_top10, r="confirmed", theta="country", color="gradient", line_close=True, color_discrete_sequence=px.colors.sequential.Blugrn)# fig.write_image('./images/px/13-polar-4.png')fig.show()
總覺得上面的雷達圖,用於這個疫情資料時,沒有太多實際意義。
不妨來看看官方的示例,如下:
df = px.data.wind()fig = px.line_polar(df, r="frequency", theta="direction", color="strength", line_close=True, color_discrete_sequence=px.colors.sequential.Plasma_r)# fig.write_image('./images/px/13-polar-5.png')fig.show()
對於風力強度,以及方位分佈的視覺化,顯得更加形象和符合實際情況。
在 Plotly Express 中,還可通過 px.imshow() 來顯示圖片以及繪製熱力圖。
圖片顯示
讀取一張圖片,並在jupyter notebook 中顯示出來,如下:
from skimage import ioimg = io.imread('./data/QR-PyDataLab.jpg')fig = px.imshow(img)# fig.write_image('./images/px/14-imshow-1.png')fig.show()如果不想圖片中顯示座標軸中的數字,可以調整軸的參數設定來實現,如下:
fig = px.imshow(img)fig.update_yaxes(# title=None, # 不顯示軸標題 visible = False,# showticklabels=True)fig.update_xaxes(visible = False)# fig.write_image('./images/px/14-imshow-2.png')fig.show()熱力圖
此外,px.imshow() 還可以用來繪製熱力圖。利用熱力圖可以看資料表裡多個特徵兩兩的相似度,在投資中,經常會考察不同投資產品之間的相關性強弱情況,就可以用熱力圖來表示,效果如下:

這裡,陽哥也以前文的資料,對三支不同的ETF之間的相關性用熱力圖來繪製,示例如下:
df_im = pd.pivot_table(df3,index=['淨值日期'], columns=['code'],values=['累計淨值'] )# 刪除外層索引df_im.columns = df_im.columns.droplevel()# 隱藏列名稱df_im.columns.name = None# 計算指數點位數值每日變化returns = df_im.pct_change().dropna()# 計算相關性corr = returns.corr()# corrfig = px.imshow(corr,color_continuous_scale='PuBu')# fig.write_image('./images/px/14-imshow-3.png')fig.show()
Plotly Express 中,還支援繪製熱力密度圖,通過 px.density_heatmap() 來實現,示例如下:
df_hp = df_global_new.set_index('date').loc['20201208':'20201208']countries_list = ['法國','義大利','英國','西班牙','阿根廷', '哥倫比亞','德國','墨西哥','波蘭','伊朗', '祕魯','土耳其','烏克蘭','南非','比利時', '印度尼西亞','伊拉克','荷蘭','智智利','捷克','羅馬尼亞' ]df_hp = df_hp[df_hp['country'].isin(countries_list)]fig = px.density_heatmap(df_hp, x="confirmed", y="cured", nbinsx=20, nbinsy=20, color_continuous_scale="Blues" )fig.write_image('./images/px/14-imshow-4.png')fig.show()
旭日圖(Sunburst Chart)是一種現代餅圖,它超越傳統的餅圖和環圖,能表達清晰的層級和歸屬關係,以父子層次結構來顯示資料構成情況。旭日圖中,離遠點越近表示級別越高,相鄰兩層中,是內層包含外層的關係。
在實際項目中使用旭日圖,可以更細分溯源分析資料,真正瞭解資料的具體構成。而且,旭日圖不僅資料直觀,而且圖表用起來特別炫酷,分分鐘拉高資料彙報的顏值!
在下面這個視訊中,針對投資組合的分佈,陽哥就使用了旭日圖,還是蠻直觀實用的。
視訊:Plotly 和 Dash 在投資領域的應用
Plotly Express 中,,通過 px.sunburst() 來實現,示例如下:
fig = px.sunburst(df_invest,path=['市場','指數名稱','標的名稱'],values='持有市值')# fig.write_image('./images/px/15-sunburst-1.png')fig.show()
可以通過設定參數 textinfo 的值來控制不同的互動顯示方式。
fig = px.sunburst(df_invest,path=['市場','指數名稱','標的名稱'],values='持有市值')fig.update_traces( textinfo='label+percent entry' # 'label+percent root', 都是按照根節點來計算百分比,根節點為100% # 'label+percent entry', 根據當前位置來計算百分比,當前的最大節點為100% # 'label+percent parent' 當前最大節點佔它的上一級節點的百分比不變,其他節點根據當前最大節點來計算百分比 )# fig.write_image('./images/px/15-sunburst-2.png')fig.show()

在進行項目進度管理時,經常會用到甘特圖,在 Plotly Express 中,,通過 px.timeline() 來實現進度視覺化,示例如下:
def plot_timeline(): df = pd.DataFrame([ dict(Task="項目1", Start='2021-02-01', Finish='2021-03-25',Manager='Lemon',Completion_pct=90), dict(Task="項目2", Start='2021-03-05', Finish='2021-04-15',Manager='Lee',Completion_pct=60), dict(Task="項目3", Start='2021-02-20', Finish='2021-05-30',Manager='Zhang',Completion_pct=70), dict(Task="項目4", Start='2021-04-20', Finish='2021-09-30',Manager='Lemon',Completion_pct=20), ]) fig = px.timeline(df, x_start="Start", x_end="Finish", y="Task") fig.update_yaxes(autorange="reversed") return figfig = plot_timeline()# fig.write_image('./images/px/16-timeline-1.png')fig.show()
針對不同的項目人員或者其他非數值型因素,還可以設定顏色分組,如下:
def plot_timeline_update(): df = pd.DataFrame([ dict(Task="項目1", Start='2021-02-01', Finish='2021-03-25',Manager='Lemon',Completion_pct=90), dict(Task="項目2", Start='2021-03-05', Finish='2021-04-15',Manager='Lee',Completion_pct=60), dict(Task="項目3", Start='2021-02-20', Finish='2021-05-30',Manager='Zhang',Completion_pct=70), dict(Task="項目4", Start='2021-04-20', Finish='2021-09-30',Manager='Lemon',Completion_pct=20), ]) fig = px.timeline(df, x_start="Start", x_end="Finish", y="Task",color='Manager') fig.update_yaxes(autorange="reversed") return figfig = plot_timeline_update()# fig.write_image('./images/px/16-timeline-2.png')fig.show()
對於數值型因素(比如完成進度比例),設定顏色分組,如下:
def plot_timeline_color(): df = pd.DataFrame([ dict(Task="項目1", Start='2021-02-01', Finish='2021-03-25',Manager='Lemon',Completion_pct=90), dict(Task="項目2", Start='2021-03-05', Finish='2021-04-15',Manager='Lee',Completion_pct=60), dict(Task="項目3", Start='2021-02-20', Finish='2021-05-30',Manager='Zhang',Completion_pct=70), dict(Task="項目4", Start='2021-04-20', Finish='2021-09-30',Manager='Lemon',Completion_pct=20), ]) fig = px.timeline(df, x_start="Start", x_end="Finish", y="Task", color='Completion_pct', color_continuous_scale=px.colors.sequential.RdBu ) fig.update_yaxes(autorange="reversed") return figfig = plot_timeline_color()# fig.write_image('./images/px/16-timeline-3.png')fig.show()
樹形圖(Treemap)適用於顯示大量分層結構(樹狀結構)的資料。
在一個樹形圖中,圖表被分為若干個矩形,這些矩形的大小和順序取決於制定變數,除此之外還常用顏色不同來表示另一個變數。
在 Plotly Express 中,,通過 px.treemap() 來實現樹形圖的視覺化,如下:
顏色為字元型,即離散型
fig = px.treemap(df_sunburst, path=[px.Constant('Invest portfolio'), '市場', '指數名稱','標的名稱'], values='持有市值', color='市場', color_discrete_sequence= px.colors.sequential.RdBu_r # 字元型,離散顏色 )# fig.write_image('./images/px/17-treemap-1.png')fig.show()
顏色為數值型,即連續型
fig = px.treemap(df_sunburst, path=[px.Constant('Invest portfolio'), '市場', '指數名稱','標的名稱'], values='持有市值', color='持有市值', color_continuous_scale='YlGnBu', # 數值型,連續顏色 )# fig.write_image('./images/px/17-treemap-2.png')fig.show()

冰柱圖(icicle)
還有一種特殊的樹狀圖,稱之為冰柱圖(icicle),冰柱圖形狀類似於冬天屋檐上垂下的冰柱,因此得名。
在 Plotly Express 中,,通過 px.icicle() 來實現,示例如下:
fig = px.icicle(df_invest, path=[px.Constant("Total Portfolio"), '市場', '指數名稱','標的名稱'], values='持有市值',# color_continuous_scale='YlGnBu', # 數值型,連續顏色 color_discrete_sequence= px.colors.sequential.RdBu_r # 字元型,離散顏色 )fig.update_traces(root_color="lightgrey")fig.update_layout(margin = dict(t=50, l=25, r=25, b=25))# fig.write_image('./images/px/17-treemap-3.png')fig.show()
對散點圖從三個維度進行視覺化,在 Plotly Express 有 px.scatter_3d 和 px.scatter_ternary() 兩個函數來實現。
三維立體空間的視覺化:
df_global_top_latest = df_global_new.set_index('date').loc['20201208':'20201208',:]countries_list = ['美國','印度','俄羅斯','巴西','法國','義大利','英國','西班牙','阿根廷','哥倫比亞','德國']df_global_top_latest = df_global_top_latest[df_global_top_latest['country'].isin(countries_list)]fig = px.scatter_3d(df_global_top_latest, x="confirmed", y="cured", z="dead", color="country", size="dead", hover_name="country", )# fig.write_image('./images/px/18-3d-1.png')fig.show()
同一個平面下,從三個維度進行視覺化:
df = px.data.election()fig = px.scatter_ternary(df, a="Joly", b="Coderre", c="Bergeron", color="winner", size="total", hover_name="district", size_max=15, color_discrete_map = {"Joly": "blue", "Bergeron": "green", "Coderre":"red"} )# fig.write_image('./images/px/18-3d-2.png')fig.show()
Plotly Express 對於地圖的視覺化提供了許多的功能,由於我自己用的並不多,這裡直接給大家介紹了官方的應用案例。
大家有興趣的話,可以進一步研究下。
示例(1):
df = px.data.gapminder().query("year == 2007")fig = px.scatter_geo(df, locations="iso_alpha", size="pop", # size of markers, "pop" is one of the columns of gapminder )fig.update_layout(margin={"r":0,"t":0,"l":0,"b":0})# fig.write_image('./images/px/19-map-1.png')fig.show()
示例(2):
df = px.data.gapminder().query("year == 2007")fig = px.line_geo(df, locations="iso_alpha", color="continent", # "continent" is one of the columns of gapminder projection="orthographic")# fig.write_image('./images/px/19-map-2.png')fig.show()
示例(3):
df = px.data.election()geojson = px.data.election_geojson()fig = px.choropleth(df, geojson=geojson, color="Bergeron", locations="district", featureidkey="properties.district", projection="mercator" )fig.update_geos(fitbounds="locations", visible=False)fig.update_layout(margin={"r":0,"t":0,"l":0,"b":0})# fig.write_image('./images/px/19-map-3.png')fig.show()
示例(4):
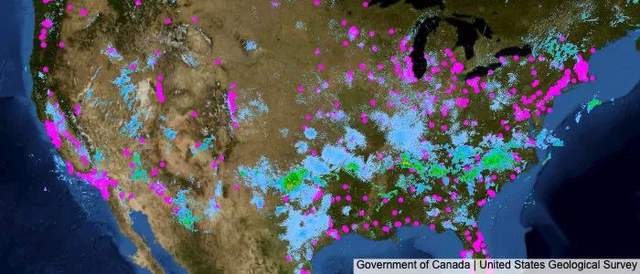
# us_cities.to_csv('./data/us_cities.csv',index=False)us_cities = pd.read_csv('./data/us_cities.csv')# us_cities = pd.read_csv("https://raw.githubusercontent.com/plotly/datasets/master/us-cities-top-1k.csv")fig = px.scatter_mapbox(us_cities, lat="lat", lon="lon", hover_name="City", hover_data=["State", "Population"], color_discrete_sequence=["fuchsia"], zoom=3, height=300)fig.update_layout( mapbox_style="white-bg", mapbox_layers=[ { "below": 'traces', "sourcetype": "raster", "sourceattribution": "United States Geological Survey", "source": [ "https://basemap.nationalmap.gov/arcgis/rest/services/USGSImageryOnly/MapServer/tile/{z}/{y}/{x}" ] }, { "sourcetype": "raster", "sourceattribution": "Government of Canada", "source": ["https://geo.weather.gc.ca/geomet/?" "SERVICE=WMS&VERSION=1.3.0&REQUEST=GetMap&BBOX={bbox-epsg-3857}&CRS=EPSG:3857" "&WIDTH=1000&HEIGHT=1000&LAYERS=RADAR_1KM_RDBR&TILED=true&FORMAT=image/png"], } ])fig.update_layout(margin={"r":0,"t":0,"l":0,"b":0})# fig.write_image('./images/px/19-map-4.png')fig.show()
示例(5):
us_cities = us_cities.query("State in ['New York', 'Ohio']")fig = px.line_mapbox(us_cities, lat="lat", lon="lon", color="State", zoom=3, height=300)fig.update_layout(mapbox_style="stamen-terrain", mapbox_zoom=4, mapbox_center_lat = 41, margin={"r":0,"t":0,"l":0,"b":0})# fig.write_image('./images/px/19-map-5.png')fig.show()
示例(6):
df = px.data.election()geojson = px.data.election_geojson()fig = px.choropleth_mapbox(df, geojson=geojson, color="Bergeron", locations="district", featureidkey="properties.district", center={"lat": 45.5517, "lon": -73.7073}, mapbox_style="carto-positron", zoom=9)fig.update_layout(margin={"r":0,"t":0,"l":0,"b":0})# fig.write_image('./images/px/19-map-6.png')fig.show()
示例(7):
df_eq = pd.read_csv('./data/earthquakes.csv')fig = px.density_mapbox(df_eq, lat='Latitude', lon='Longitude', z='Magnitude', radius=10, center=dict(lat=0, lon=180), zoom=0, mapbox_style="stamen-terrain")fig.update_layout(margin={"r":0,"t":0,"l":0,"b":0})# fig.write_image('./images/px/19-map-7.png')fig.show()
在 Plotly Express 使用過程中,經常會設定多種顏色,Plotly 中內建了多種顏色,咱們可以熟悉下,方便使用。
下面跟大家分享兩種我常用的顏色體系:


對於顏色搭配,有興趣的同學可以自行研究。配色是一門高深的藝術,裡面門道還是很多的哈~~
Plotly 生態系統的一部分
Plotly Express 在 2019年初剛釋出的時候,是一個單獨的 Python 庫,在後來的版本中,Plotly 官方將 Plotly Express 合併到 Plotly 中了,因此, Plotly Express 可以使用 Plotly 中大部分介面來對圖形進行個性化設定。這個也可以認為是 Plotly Express 相對其他 基於 Plotly 的第三方庫(比如 cufflinks)的一些優勢之處。
能夠與 Dash 完美匹配
Dash 是 Plotly 的開源框架,用於構建具有 Plotly.py 圖表的分析應用程式和儀表板。
Plotly Express 產生的物件與 Dash 100%相容。
在下面這個視訊中,針對投資組合的分析,陽哥就綜合使用了Plotly、Plotly Express 以及Dash,還是蠻實用的。
視訊:Plotly 和 Dash 在投資領域的應用
最後,Plotly Express 作為一個簡潔實用的 Python 視覺化庫,在 Plotly 生態系統下,發展迅速,所以不要猶豫,立即開始使用 Plotly Express 吧!
相關文章

作者:陽哥來源:Python資料之道大家好,我是陽哥。今天跟大家分享的是 Plotly Express 的詳細使用教程。Plotly Express 是 Python 互動式視覺化庫 Plotly 的高階元件,受 Seaborn
2021-07-24 03:07:05

機器之心專欄機器之心編輯部這篇來自 CMU 和 HKUST 科研團隊的 ICML 論文,僅通過調整訓練演算法,在 ImageNet 資料集上取得了比之前的 SOTA BNN 網路 ReActNet 高1.1% 的分類
2021-07-24 03:06:53

民間又有高手「出沒」:一位「技術宅」自制的自行車碼錶在B站火了,短短几天引來20多萬人圍觀!速度、距離、時間、卡路里、航向顯示的記錄功能自不用多提,還可顯示經緯度和海拔。
2021-07-24 03:06:05

7 月 31 日至 8 月 1 日,GOTC 全球開源技術峰會深圳站將在深圳會展中心召開。31 日,由華為開源運營專家,容器技術、DevOps 等領域技術專家馬全一擔任出品人的「作業系統」專題
2021-07-24 03:05:08

科技的發展不僅是改變了人們的生活方式,更多的是改變了人們看待事物的方式。在過去,沒人能想象到未來的人,可以和大洋彼岸的人實時溝通交流、可以去探索月球、可以去探測深海..
2021-07-24 03:03:39

我們知道有23個設計模式,但是大多停留在概念層面,真實開發中很少遇到。但是優秀的開源框架中使用了大量的設計模式,閱讀源碼並觀察設計模式在其中的應用,能夠更深入的理解設計模
2021-07-24 03:03:26